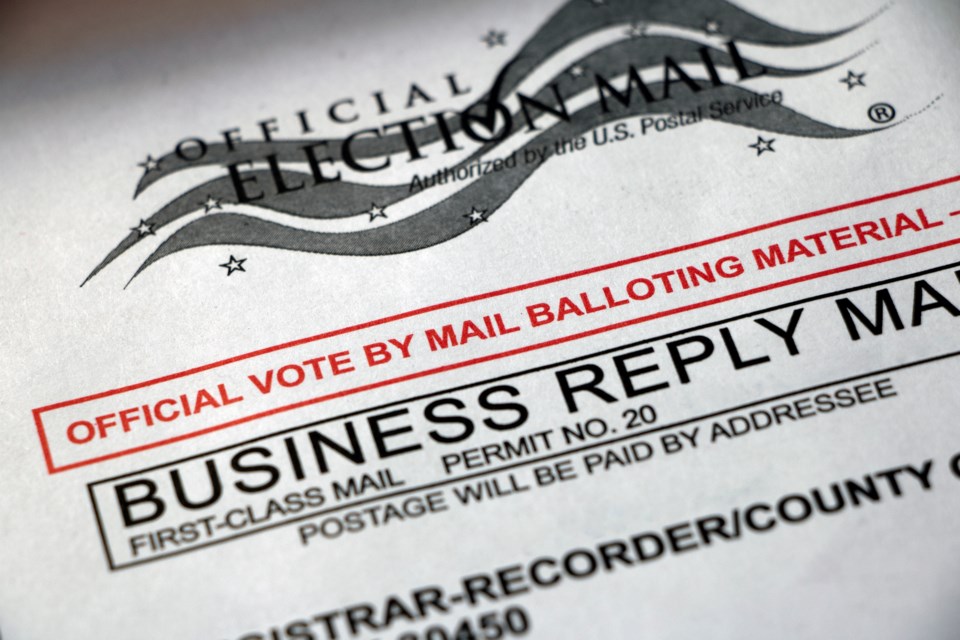
One dirty sock, 500 cookies, 230,721 active voters.
The Boulder County Elections Division 2020 Post-Election Data Report released Thursday digs into the numbers for the year, including the dirty sock that was the “grossest thing” found in a ballot box last year.
Of the 230,721 active eligible voters in the county in 2020, 43,7% were registered as Democrats, 13.3% as Republicans and 41.5% as unaffiliated, with Libertarian and other parties rounding out the rolls, according to the report.
The 500 cookies were donated and eaten by election workers.
The report was released as an infographic and “highlights different facets of mainly the General Election and the voting populace. It is a data dive into voter registration statistics, voter turnout, voting method, how we conduct the election, voter communication and more,” according to a news release from the Elections Division.
It’s here! Our 2020 Post-Election Data Report! See voter stats, turnout, info on conducting the #election & more!
— Boulder County Clerk / Clerk Molly Fitzpatrick (@BoCoClerk) February 4, 2021
Find out:
✅# of people working #ELECTIONDAY
✅% of #voters who used a drop box
✅# of #cookies donated & eaten (Thx @CrumblCookies!)
👉 https://t.co/uOZrgvo8fy pic.twitter.com/S5PW1PnStv
Other details revealed in the report include:
- Voter turnout by age
People ages 61 to 70 had the highest turnout at 95.92%, followed by those ages 41 to 60 at 93.63%. Young voters didn’t sit out the election, though, with 79.7% of 18- to 25-year-olds and 85.11% of 26- to -40-year-olds casting ballots last year. Those 71 and older participated at a rate of 95.4%.
Those numbers are nearly identical to turnout in the 2016 general election when 79.79% of 18- to 25-year-olds, 84.71% of 26- to 40-year-olds, 93.55% of 41- to 60-year-olds, 95.11% of 61- to 70-year-olds and 93.08% of those 71 and older voted.
- Voter turnout by election
Turnout for the General Election was 90.1%; in the June primary turnout totaled 54.9% and in the presidential primary it totaled 63.3%.
Overall turnout was excellent as usual, Boulder County elections spokeswoman Mircalla Wozniak said via email.
While Boulder County voter turnout has typically been excellent, that has not always been the case across the country. However, 2020 was different. “Americans voted in record numbers in last year’s presidential election, casting nearly 158.4 million ballots. That works out to more than six-in-ten people of voting age and nearly two-thirds of estimated eligible voters,” according to a Pew Research Center analysis.
Turnout rates increased in every state, according to Pew, which found that Colorado had a statewide voter turnout rate of 75.5%.
- Voter registration
New or updated registrations recorded since Aug. 1 add up to 67,212.
- Voting method
The majority of county voters — 94.9% — cast a mail ballot, with 81% of them using 24-hour drop boxes. Five percent, or 4,508 people, cast ballots in person.
- Election staffing
The county hired 555 temporary election judges and workers, had 35 student judges, 49 county employee ambassadors. Six-hundred and thirty-eight people worked on Election Day.
The county’s interactive 2020 General Election Turnout Map also is live and shows turnout by precinct. In Longmont-area precincts, turnout ranged from less than 85% to 93%, according to the map.
More information on the 2020 General Election, including the Election Security Community Briefing, final canvass documents, audit documentation, and the official Statement of Votes, is available at www.BoulderCountyVotes.org.


