This content was originally published by the Longmont Observer and is licensed under a Creative Commons license.
Forecast Discussion:
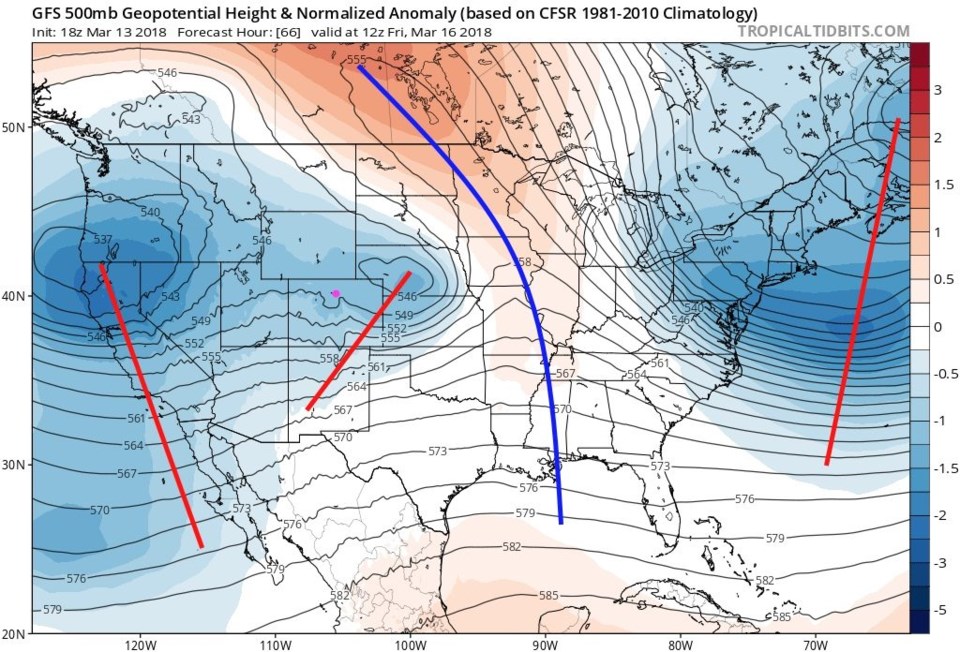
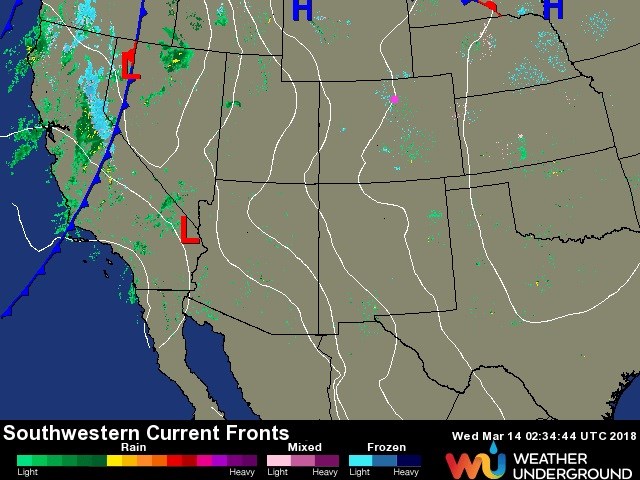
Pardon me if I get excited to see real weather (another 8 graphics today!). Our next front has moved on shore in California bringing them beneficial rains and snows (Figure 1).
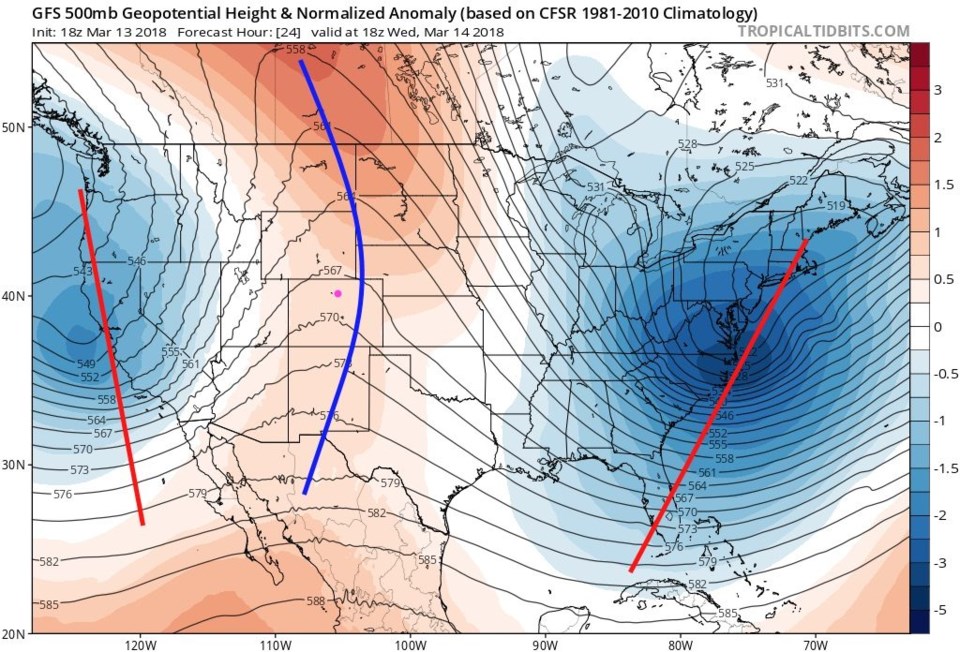
With some down slope flow and the big ridge overhead, in advance of this storm, we will break the 70F mark today (Figure 2 for the big ridge on top of us).
The longer range forecast:
Figure 3 is this same map for Friday AM, an upper air low has broken off of the trough on the West coast and is bringing us, what looks to be, about 0.20 to 0.50 inches of rainfall (not snow). The system may produce snow later Friday AM from the wrap-around flow, but it won't be much for Longmont.
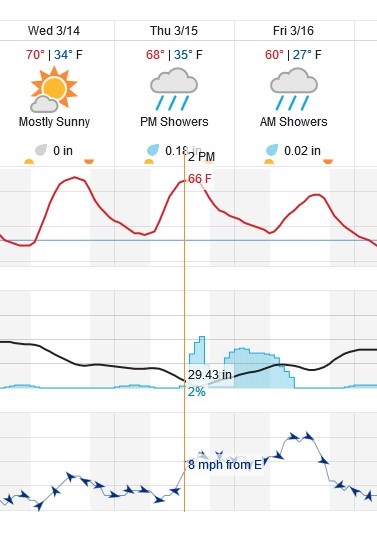
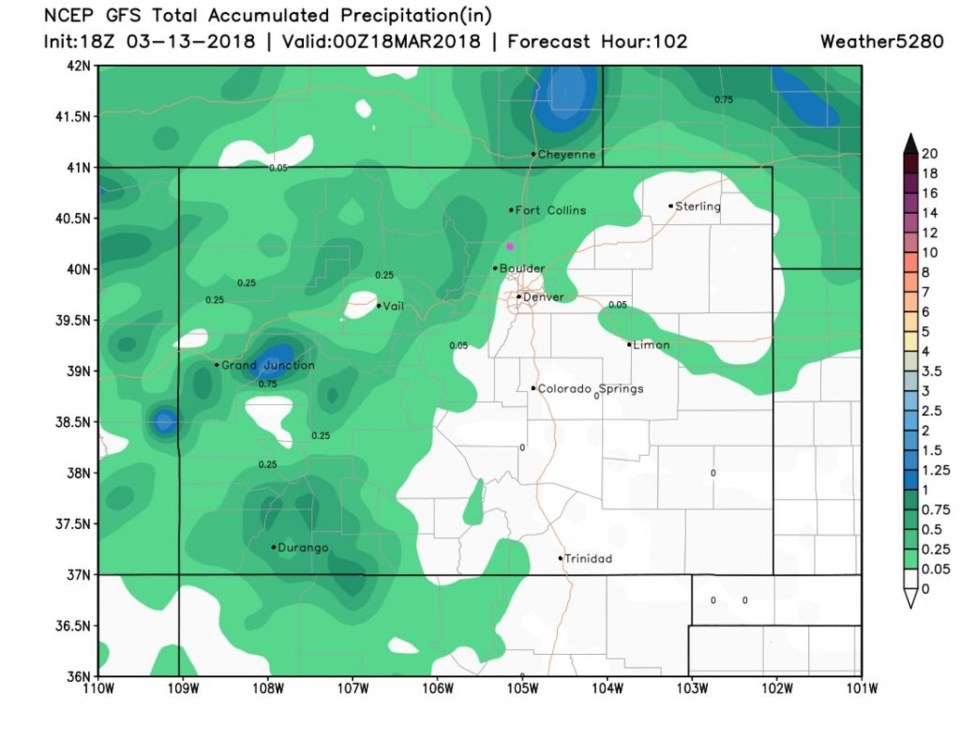
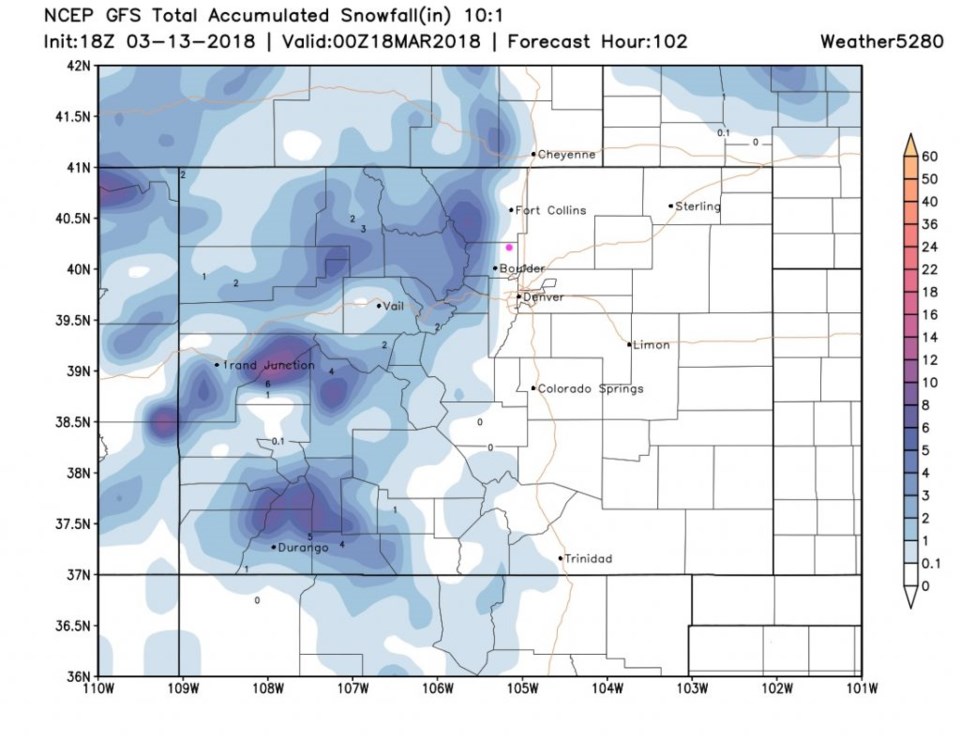
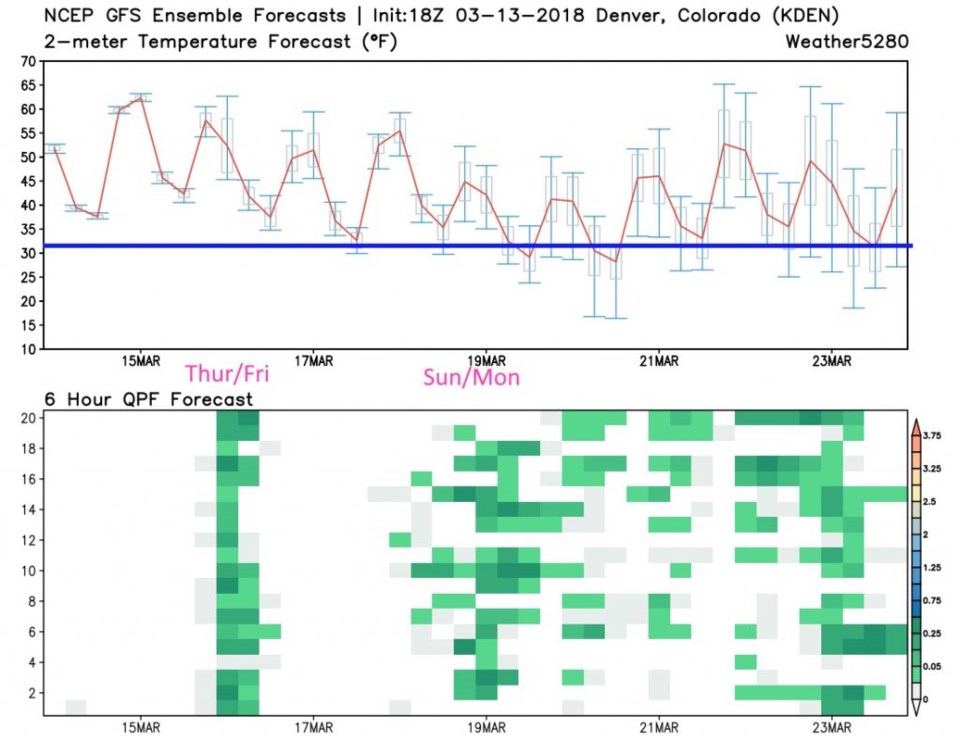
Figure 4 shows the timing of the rainfall - with chances of rain jumping up after 2-3pm Thursday and continuing until Friday afternoon. Figure 5 suggests about 0.05-0.25 inches of rain. Figure 6 shows snow is close to the west (Lyons); but no significant snow in town.
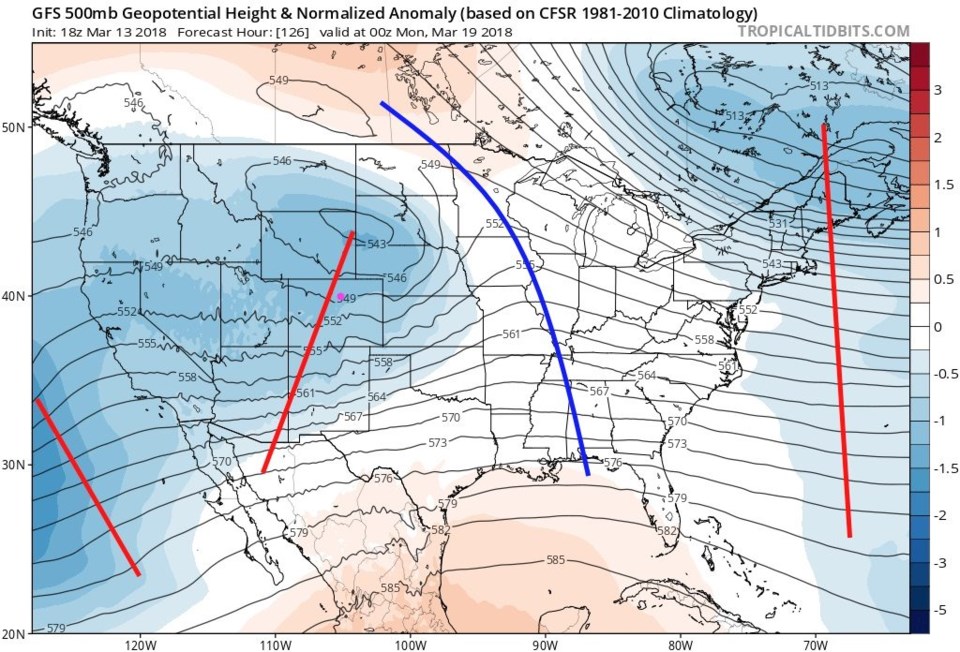
Looking further out, Sunday night, the upper air pattern is very very similar to what we see in Figure 3/Friday AM. There is another low out ahead of the West coast trough, but it is a bit further north in Wyoming and South Dakota (Figure 7).
Finally, Figure 8, shows the nice period of (confident) rainfall Thurs/Friday. The graph up on top keeps the temperatures above freezing day and night most of the next 10 days (the horizontal blue line I added to the graph). Beyond that, things get very unsettled with rain chances almost every day next week. Exciting!